
")
")


NHI (Normalized Hotspot Indices): a tool for mapping volcanic thermal anomalies at a global scale from space.
NHI (Normalized Hotspot Indices; Marchese et al., 2019) is a multichannel algorithm developed, in collaboration with the School of Engineering of the University of Basilicata (Italy), for the rapid mapping of volcanic thermal anomalies at a global scale, using infrared Sentinel 2 MSI (Multispectral Instrument) (https://earth.esa.int/web/sentinel/technical-guides/sentinel-2-msi/msi-instrument) and Landsat 8 OLI (Operational Land Imager) (https://landsat.gsfc.nasa.gov/operational-land-imager-oli/) data. The algorithm uses two normalized indices, analyzing TOA (top of atmosphere) SWIR (short wave Infrared) and NIR (near infrared) radiances to map volcanic hotspots of different temperature/spatial extent.
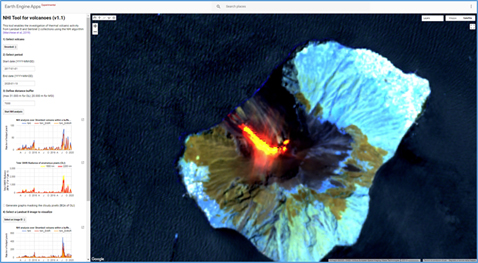
The NHI tool, exploiting the high computation capabilities offered by Google Earth Engine (https://earthengine.google.com/) which is a platform for petabyte-scale scientific analysis and visualization of geospatial datasets, enables the analysis of more than 1400 volcanic areas worldwide. In particular, the tool allows the users to select the volcano, define the distance buffer and time period of interest, generating thermal anomaly maps, plots of hotspot pixel number and total SWIR radiance. Moreover, satellite RBG maps may be visualized as well for a visual inspection of the scenes. Users may also select the Quality band (BQA) of OLI, and the bitmask band with cloud mask information (QA60) for MSI to perform a cloud check.
Since NHI is sensitive to hot targets, fires occurring along the volcano flanks may be flagged as volcanic hotspots. Users should be also aware about the possible generation of artefacts mainly in correspondence of cloud edges probably due to the multispectral misregistration of Sentinel 2 images over moving and high-altitude objects (Skakun et al., 2017).
To start the tool click here ![]()
Contacts: Questo indirizzo email è protetto dagli spambots. È necessario abilitare JavaScript per vederlo.; Questo indirizzo email è protetto dagli spambots. È necessario abilitare JavaScript per vederlo.
References
Marchese, F., Genzano, N., Neri, M., Falconieri, A., Mazzeo, G., Pergola, N. A Multi-Channel Algorithm for Mapping Volcanic Thermal Anomalies by Means of Sentinel-2 MSI and Landsat-8 OLI Data. Remote Sensing 2019, 11, 2876.
Skakun, S., Vermote, E., Roger, J. C., and Justice, C. Multispectral Misregistration of Sentinel-2A Images: Analysis and Implications for Potential Applications. IEEE Geoscience and Remote Sensing Letters, 14(12), 2408-2412.